
From Web Interface to Monitoring: A Custom Prometheus Exporter for the Sodola Switch
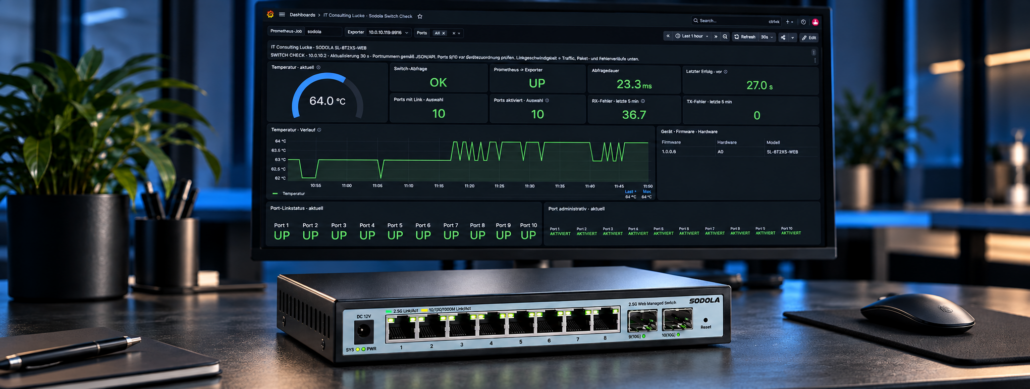
My network includes a Sodola SL-8T2XS-WEB. Its web interface displays temperature, port status and packet statistics. I wanted to bring this information into my existing monitoring setup: collect it automatically, store it over time and display it on a Grafana dashboard.
This led to a custom Docker-based exporter — and eventually a downloadable package that makes the solution usable in other installations.
The Goal and the Prerequisites
The key questions were straightforward: How hot does the switch get? Which ports are connected? What speeds have the links negotiated? And are any transmission errors occurring?
Prometheus and Grafana were already in place. A monitoring VM running Docker provided a platform for additional exporters. The switch itself should not need any additional software; data collection would take place externally.
Our confirmed hardware was a Sodola SL-8T2XS-WEB running firmware 1.0.0.6, hardware revision A0. To query it, we needed network access to its management interface and valid login credentials.
The Approach: Where Could We Get the Data?
Our first step was to take a closer look at the existing web interface. If the browser can display temperature and port statistics, it must receive that information from the switch.
The important part was the communication behind the visible page: What requests does the browser send, and how does the switch respond?
Using the Browser as a Tool
We used the Network tab in the browser's developer tools to inspect the requests made when opening the status and port statistics pages.
We found two useful endpoints:
/status.json
/port_statistics.json
status.json provided the temperature along with model, firmware and hardware information.
port_statistics.json contained the administrative state, link status and counters for transmitted and received packets and errors for all ten ports.
This gave us structured JSON data to work with. There was no need to scrape the tables displayed in the web interface.
The First Hurdle: Authentication and Sessions
A direct request using curl initially returned no JSON data. Instead, the switch responded with an HTML instruction redirecting the browser to the login page.
The notable detail was that the HTTP status was still 200 OK. A successful HTTP request did not necessarily mean we had received usable measurements.
Next, we examined the JavaScript code on the login page. Authentication takes place through /authorize, with the username and password each transmitted as an MD5 hash. After authentication, the browser uses session cookies.
We reproduced this sequence in the exporter:
- Query the two JSON endpoints.
- Detect when authentication is required.
- Log in and store the cookies.
- Request the data again.
- Reuse the session for subsequent requests.
MD5 is part of the device's authentication protocol; it does not encrypt the connection. Management access should therefore remain within a trusted network.
Turning JSON into a Custom Exporter
The exporter was implemented in Python and exposes the measurements at /metrics in Prometheus format.
Device temperature and port states are exposed as gauges. Cumulative packet and error counts are published as counters. Prometheus can use rate() to calculate values such as received packets per second.
We accounted for an important limitation: the API we examined provides packet counters but no byte counters. These values cannot be used to calculate reliable traffic rates in Mbit/s. Negotiated port speed is displayed separately; it describes the link speed rather than its current utilisation.
Failure handling was also included. If the device query fails, the exporter reports sodola_up 0 and does not return stale device measurements for that request.
Running the Exporter in Docker
For ongoing operation, we packaged the exporter with Docker Compose. It runs on the monitoring VM and requires no installation on the switch.
Prometheus queries the exporter regularly. Each request to /metrics triggers a query of both JSON endpoints. The scrape interval therefore also determines how often the switch is queried.
The username and password are supplied through local files mounted as Compose secrets. For the downloadable package, we added a setup prompt for the switch IP address. Setup now asks for the IP address, username and password, rather than including a personal device address in the package.
Visualising the Data in Grafana
Once the metrics were reaching Prometheus, we built a dedicated Grafana dashboard.
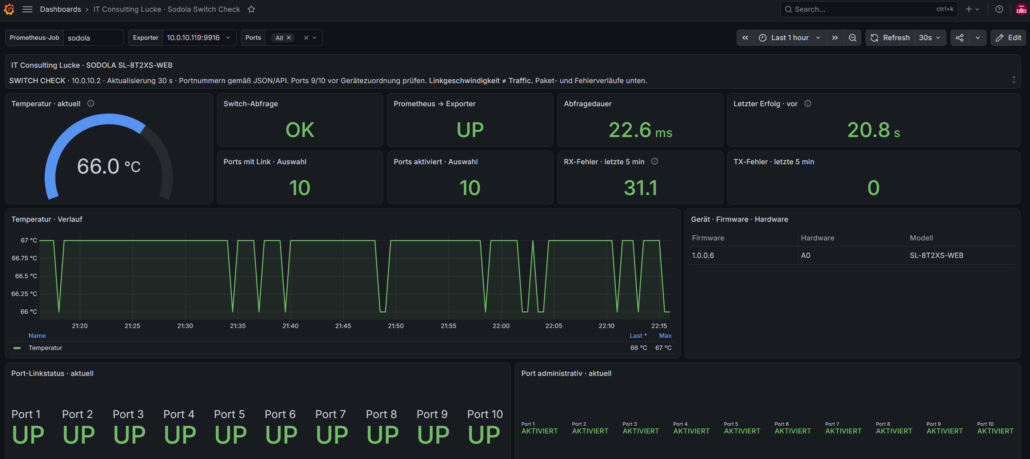
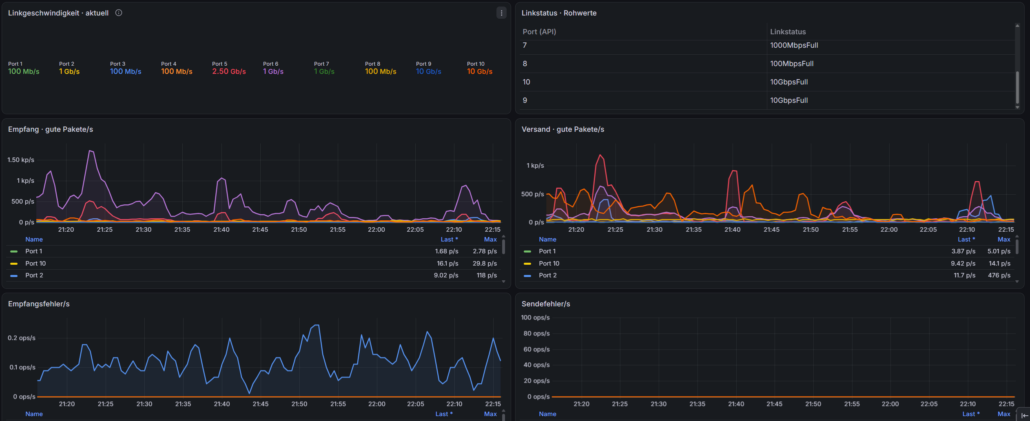
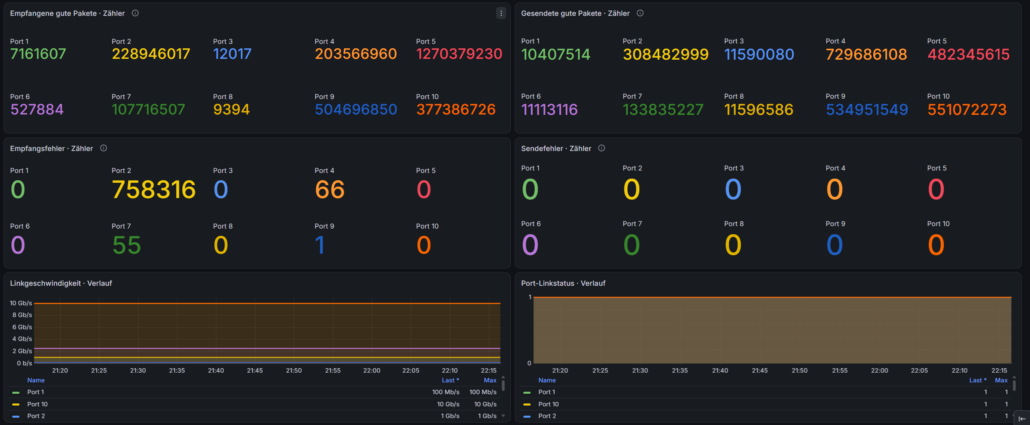
Temperature is displayed both as a gauge showing the current value and as a time series. Port states, link speeds and graphs of packet and error rates complete the overview.
This makes both current conditions and changes easy to spot: a switch getting warmer, a failed link or increasing receive errors on a particular port.
For display on a kiosk monitor, we then combined the key information into a compact infrastructure overview.
The Result
An existing web interface became the basis for automated monitoring. The browser helped us understand the data sources and authentication. The Python exporter translates the data into Prometheus metrics, Docker handles deployment and Grafana presents the results clearly.
The downloadable package includes the setup script, Docker configuration and a Prometheus configuration example. It contains no personal login credentials.
The solution has been confirmed for the switch model and firmware version stated above. Whether other Sodola models use the same endpoints and authentication process needs to be checked individually.


Leave a Reply
Want to join the discussion?Feel free to contribute!